Introduction
This tutorial will help you learn many things – how to use MongoLab API for CRUD operations, how to get browser info and version and how to use google charts. What we are going to achieve is, to create a real-time page which keeps updating the hits with browser info and also renders the page with the stats.
Pre-requisite
You should at least know what MongoDB is and the flexibility it offers. You can read it right here. MongoLab is the cloud API provider for MongoDB. It also provides a REST interface for the same. Opening a account is free and so I would advise you to get one in case if you wanted to try MongoLab in your small projects. Do NOT try and use the key I used in my JavaScript. It’s not going to cost me anything because its a free account but again, I would have to manually login and clear those items if you use my ID for your demo apps :).
Storing browser info
The idea is to figure out the browser name and version and if it is already in DB, just increment the hit number else insert a new row.
/* Util method to get browserName and browserVersion from navigator. Source: stackoverflow.com. */ navigator.sayswho = (function () { var N = navigator.appName, ua = navigator.userAgent, tem; var M = ua.match(/(opera|chrome|safari|firefox|msie)\/?\s*(\.?\d+(\.\d+)*)/i); if (M && (tem = ua.match(/version\/([\.\d]+)/i)) != null) M[2] = tem[1]; M = M ? [M[1], M[2]] : [N, navigator.appVersion, '-?']; return M; })(); if (navigator.sayswho.length > 1) { navigator.cBrowserName = navigator.sayswho[0]; navigator.cBrowserVersion = navigator.sayswho[1]; } |
Now you do have browser name and version after the above steps. The task is to figure out whether the row is already present in DB or not. Querying the DB is easy with JavaScript but it is a shame that you can’t do that for commercial website because people will use the key to query your DB directly.
$.ajax( { url: "https://api.mongolab.com/api/1/databases/webdev/collections/hits?apiKey=<YOUR_KEY>&q=" + queryStr, type: "GET", contentType: "application/json", async: true, timeout: 5000, success: function (data) { .. }, error: function (xhr, status, err) {} }); |
The insert and update code is pretty straightforward.
function updateDB(browser, version, hits) { var queryObj = {"browser": browser, "version": version}; var queryStr = JSON.stringify(queryObj); // API Key needs to be changed to yours. This key is, however, a free limited space key and you can get one for yourself. // https://mongolab.com/welcome/ : Sign up and get 500MB free. $.ajax( { url: 'https://api.mongolab.com/api/1/databases/webdev/collections/hits?apiKey=<YOUR_KEY>&q=' + queryStr, data: JSON.stringify( { "$set" : { "hits" : hits } } ), type: "PUT", contentType: "application/json" }); } /* Insert the new browser info here. */ function insertToDB(browser, version) { // API Key needs to be changed to yours. This key is, however, a free limited space key and you can get one for yourself. // https://mongolab.com/welcome/ : Sign up and get 500MB free. $.ajax( { url: "https://api.mongolab.com/api/1/databases/webdev/collections/hits?apiKey=<YOUR_KEY>", data: JSON.stringify( { "browser" : browser, "version" : version, "hits" : 1} ), type: "POST", contentType: "application/json" }); } |
The posting part is now over.
Get browser stats
Let’s query the DB with browser name as sort order.
$.ajax( { url: "https://api.mongolab.com/api/1/databases/webdev/collections/hits?apiKey=<YOUR_KEY>&s="+queryStr, type: "GET", contentType: "application/json", async: true, timeout: 5000, success: function (data) { .. }, error: function (xhr, status, err) { } }); |
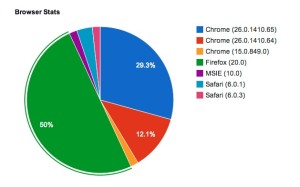
Google charts is a fantastic API to display charts. It is the easiest way and also the best I’ve seen.
google.load("visualization", "1", {packages:["corechart"]}); google.setOnLoadCallback(<callbackmethod_to_query_DB>); ....... // after query var data = google.visualization.arrayToDataTable(browserData); var options = {title: 'Browser Stats'}; var chart = new google.visualization.PieChart(document.getElementById('chart_div')); chart.draw(data, options); |
That’s it folks! Take a look at demo here.